Having access to Microsoft Azure Copilot has been really interesting. On one hand, the use cases are almost limitless, essentially a choice of what do you want to try do with it? On the other, there is still work to be done to maximise its potential (acknowledge by Microsoft throughout use in fairness).
Working with any of the ‘Copilots’, one important element for me is to get a grounded understanding of what it is capable of, based on something I am an expert on. I cannot tell how good it is if I am asking it help with something I don’t know arguably better than it does. So – let’s I decided to push it with a Virtual Network.
My objective when starting this post was to hopefully reach the point where one single, detailed prompt would spit out an acceptable VNET design statement, perhaps even the code to build it, but that part was less important to me right now. Anyone can create a good Azure design right? 🙂
I am first going to outlay my thinking with respect to a VNET, it’s purpose, my security posture, connectivity requirements, and likely workloads. Rewording this into a statement that is aligned to the Cloud Adoption Framework, and Azure Network Architecture details.
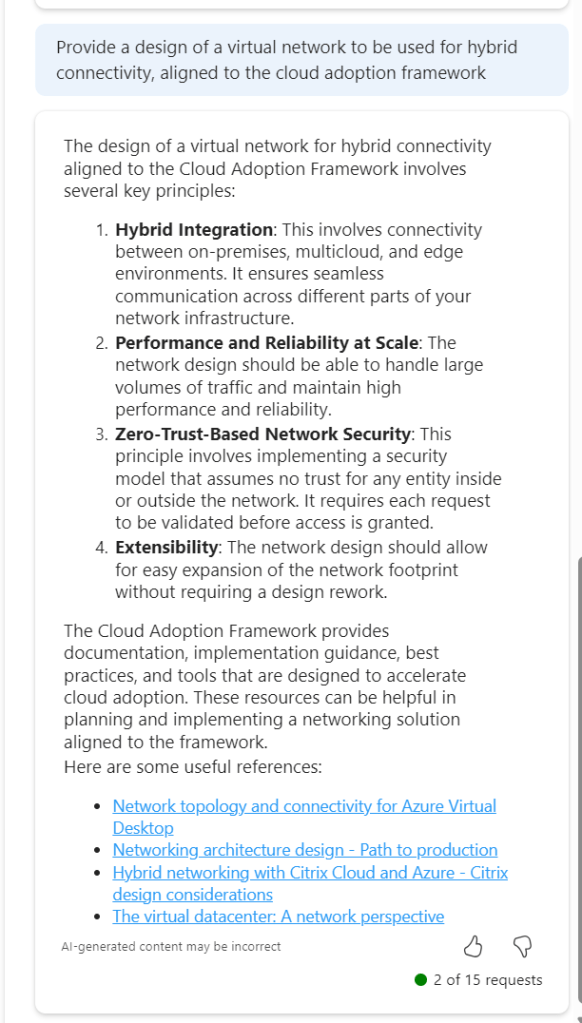
To get a baseline of a basic prompt, I started with the below. I believe this helps work towards the ‘best’ prompt.
So this jumps all over the place. We have perimeter references, AVS and App Gateway all mentioned. Not ideal. But I did ask for an example, and it does provide links. So let’s tighten our prompt.
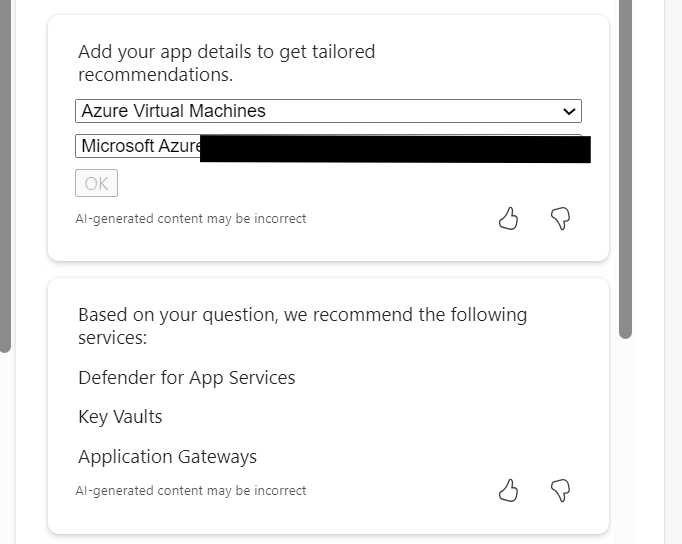
This is much better, proper sequential statements, however that third link to hybrid with Citrix is irrelevant. Now, as Copilot functions in a chat method, let’s use this prompt and response to expand detail.
So this approach doesn’t work. When you select the (perhaps) relevant items, the output is not aligned to the original ask.
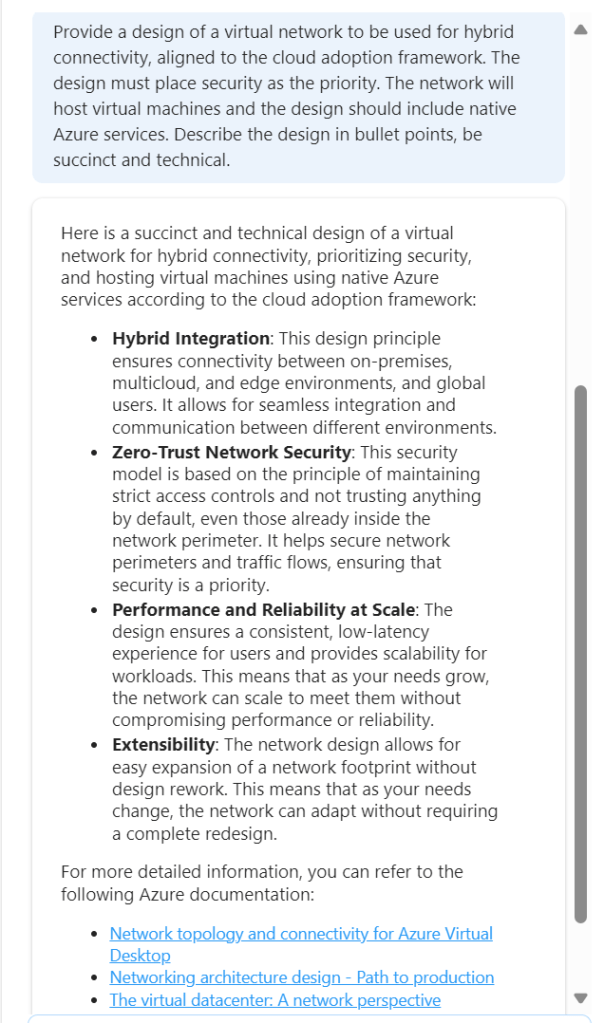
So – let’s try this another way. We know the first recommend prompt returned good results. Rather than continue in a chat-response format, let’s try one very specific prompt. To ensure no confusion – I started a new chat for this.
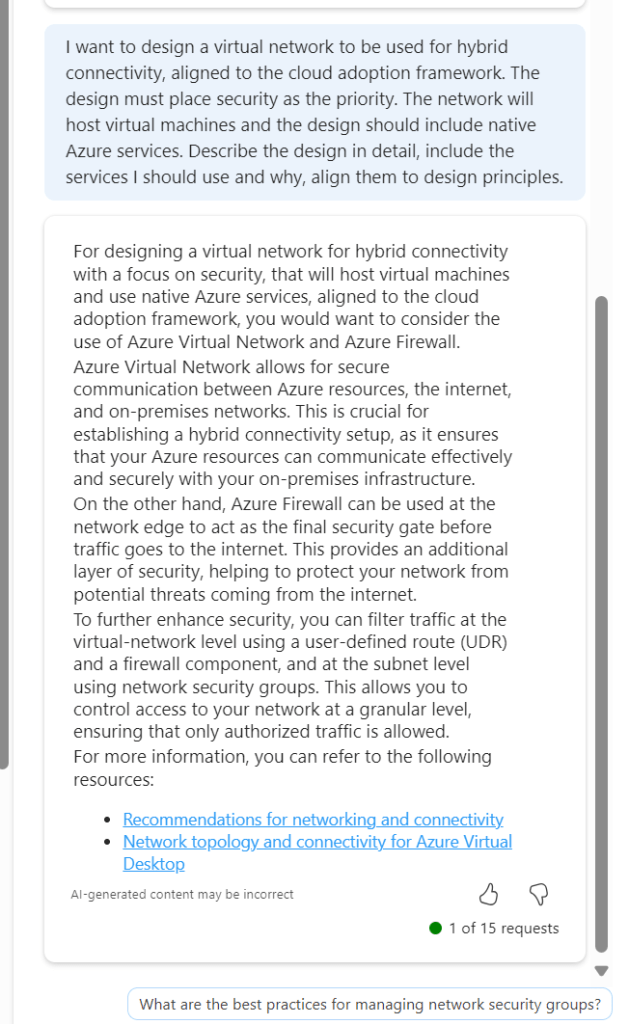
This is better, but to be honest – I am not looking for design principles like ‘zero trust’. So we need to adjust the wording. Again, I have started a new chat for this.
Now we are getting somewhere. If this had included Bastion I would have ranked it 9/10. The first link is good, second link is not so this scores a 7/10 for me. It is a great improvement on previous asks, and I am trying to ask as few leading questions as possible. I tried another following response to get some more detail
Again, the general detail is good, but the links are hit and miss. This could introduce some confusion. I tried another follow on from this, but again it went a different route based on my existing subscription services.
Rather than say this didn’t work, I think I have set out with a task that isn’t really achievable at present. There are so many elements that require consideration, some sequential, some overlapping, some interdependent, that a single chat response is going to be very difficult if not impossible. At the same time, repeat responses are also challenging, especially when you’re not looking for something relevant to what you currently have, but aligned to best practice.
Overall, I think Copilot for Azure is improving every month, and the use cases are constantly expanding. However, I don’t believe, based on current functionality that it will be able to fully assist with design guidance and decisions, beyond providing principles and guided links. For the real design work – you will still need an expert 😉
Ever since the change to Azure Firewall Policy from classic rules, there has been a requirement and a want to have greater inspection capabilities with regard to your Azure Firewall Policies (AFPs). Depending on your environment, you might have several, or several hundred AFPs in place, securing your Azure footprint. Regardless, analytics of these policies is crucial.
With the increasing adoption of cloud workloads, and as workloads move to the cloud, network security policies like AFPs must evolve and adapt to the changing demands of the infrastructure, which can be updated multiple times a week, which can make it challenging for IT security teams to optimise rules.
Optimisation while at least retaining, if not increasing security, is key objective with AFP Analytics. As the number of network and application rules grow over time, they can become suboptimal, resulting in degraded firewall performance and security. Any update to policies can be risky and potentially impact production workloads, causing outages, unknown impact and ultimately – downtime. We’d like to avoid all of that if possible!
AFP Analytics offers the ability to analyse and inspect your traffic, right down to a single rule. Several elements are enabled without action, however, I would recommend enabling the full feature set, which is a simple task. Open the AFP you’d like to enable it for, and follow the steps linked here.
Once enabled, AFP Analytics starts to fully inspect your Policy and the traffic passing through it. My demo Azure Firewall, currently looks fantastic, as nothing is happening 🙂
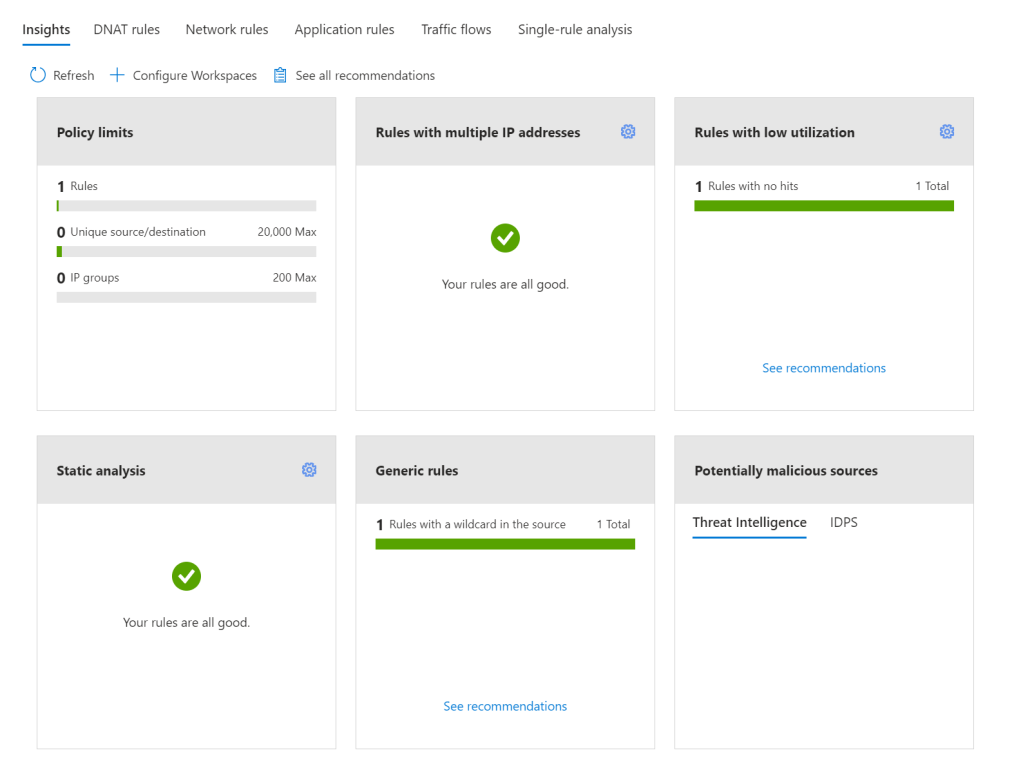
There are several key features to make use of with AFP Analytics, Microsoft list them as follows:
Policy insight panel: Aggregates insights and highlights relevant policy information. (this is the graphic above)
Rule analytics: Analyses existing DNAT, Network, and Application rules to identify rules with low utilization or rules with low usage in a specific time window.
Traffic flow analysis: Maps traffic flow to rules by identifying top traffic flows and enabling an integrated experience.
Single Rule analysis: Analyzes a single rule to learn what traffic hits that rule to refine the access it provides and improve the overall security posture.
Now I view all of these as useful. I can see the purpose and I can see myself using them regularly. However, I was most excited about – Single Rule Analysis – that was, until I went to test and demo it.
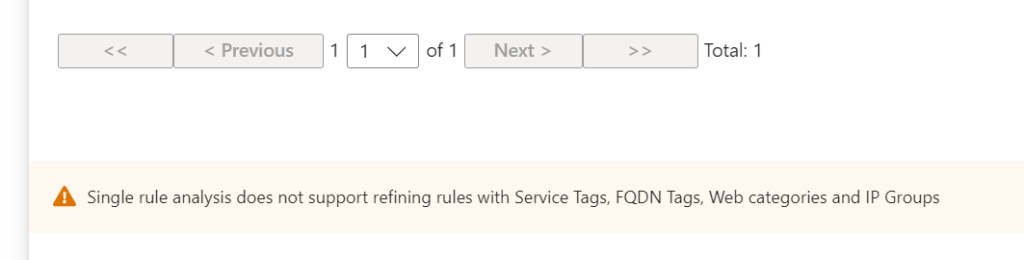
I created a straight forward Application rule, a couple of web categories allowed on HTTPS. I enabled Analytics, sat back for a bit, got a coffee (it recommends 60 minutes due to how logs are aggregated in the back end) and then tried it out. To my disappointment, I was met with the below:
Tags and categories I could initially understand, but IP Groups confused me. I thought, this is a core feature, why not allow analysis when this is in scope – then I realised; the analysis is aiming to optimise the rule. AFP views rules using these as fairly spot on already. So, I decide to create a stupid rule (in my opinion). Allowing TCP:443 from around 20 IPs to around 10 IPs. First up, my Insight Panel flagged it
Next, Single Rule Analysis and…success, it dislikes the rule! It summarises it, and flags the aspects it does not feel are optimal. I did expect the recommendation to be to delete the rule, as you can see it is flagging there is no traffic matching the rule, but perhaps the caution here is in combination with the rule and data in place for the last 30 days, or lack thereof.
A final note. While you might think that it’s only the Log Analytics element you have to pay for to make use of AFP Analytics, you would be wrong. There is a charge for the enablement, analysis, and insight components. These price in at around €225/month, billed hourly. So double check your budget before enabling on every AFP.
As always, if you have any questions, please just ping me!
Anyone who follows this blog knows that Azure Firewall is a key resource for me in successful Azure deployments. Its combination of ease of deployment and functionality easily outpace alternative vendor choices on Azure. Up until now, we have had a Standard and Premium SKU. The Premium SKU introduced new features to Standard. Now, we have a Basic SKU and several features have been removed. Let’s explore what the Basic SKU offers.
First up, deployment and infrastructure. At it’s core, Basic is the same resource. Meaning it still has built-in HA. However, it is a fixed scale, meaning two instances only. However, Availability Zones are still covered, meaning choices up to 99.99% for SLAs are achievable. Fixed scale does mean a more limited bandwidth capability, Basic has up to 250Mbps in comparison to Standard which is up to 30Gbps. That’s not a typo!
Microsoft call out the fact they are targeting SMB customers with this SKU. But that doesn’t mean that the features of Basic wouldn’t suit an Enterprise spoke, or specific environment requirement where cost vs features work.
So let’s take a look at the features included. The basics are all the same, multiple Public IPs, inbound/outbound NAT etc. (there is a full list here) but some specifics worth calling out are:
Network Rules – As Basic does not support DNS Proxy, you can only use standard, non-FQDN rules in Network filtering. More on that for Standard here.
Threat Intelligence – While it can be enabled, it can only be used in alert mode. This means you would have to accept this, and/or monitor logs to adjust rules based on alerts.
This means that once you are aware of the functionality and limitations, Basic may be a great choice for your environment. Especially when you consider one of its main benefits – cost. There are two costs associated directly with Azure Firewall:
Deployment
Data Processing
Deployment wise, Basic is considerably cheaper versus Standard. Deploying to North Europe, Basic should be approximately €266/month in comparison to Standard at circa €843/month.
However, data processing is more expensive on Basic. 1Tb of data processing for Basic, in North Europe will be approximately €62/month, which is quite a bit more than Standard coming in at around €15/month. So this is definitely one to keep an eye on in your environment. There is no reservation or similar choice here, Standard and Premium simply have a lower processing price.
Thankfully, integration with Azure Monitor is unchanged across SKUs, so you can capture all of the data you need.
The experience within portal, or via shell for deployment and management is also unchanged. The portal dynamically calls out what is allowed/functional when using a Basic policy, so confusion is avoided.
In conclusion, I think Basic is a great addition to the AFW family. I would have liked to see DNS Proxy included in the feature set, I see this deployed everywhere now and the Network rule functionality it adds is excellent. I am also interested to see how/if that throughput limit will come into play for specific scenarios.
As always, if there are any questions, please get in touch!
Azure Firewall is ever growing in popularity as a choice when it comes to perimeter protection for Azure networking. The introduction of additional SKUs (Premium and Basic) since its launch have made it both more functional while also increasing its appeal to a broader environment footprint.
For anyone who has used Azure Firewall since the beginning, troubleshooting and analysis of your logs has always had a steep-ish learning curve. On one hand, the logs are stored in Log Analytics and you can query them using Kusto, so there is familiarity. However, without context, their formatting can be challenging. The good news is, this is being improved with the introduction of a new format.
Previously logs we stored using the Azure Diagnostics mode, with this update, we will now see the use of Resource-Specific mode. This is something that will become more common across many Azure resources, and you should see it appear for several in the Portal already.
Destination table in the Portal
What difference will this make for Azure Firewall? This will mean individual tables in the selected workspace are created for each category selected in the diagnostic setting. This offers the following improvements:
Makes it much easier to work with the data in log queries
Makes it easier to discover schemas and their structure
Improves performance across both ingestion latency and query times
Allows you to grant Azure RBAC rights on a specific table
For Azure Firewall, the new resource specific tables are below:
Network rule log – Contains all Network Rule log data. Each match between data plane and network rule creates a log entry with the data plane packet and the matched rule’s attributes.
NAT rule log – Contains all DNAT (Destination Network Address Translation) events log data. Each match between data plane and DNAT rule creates a log entry with the data plane packet and the matched rule’s attributes.
Application rule log – Contains all Application rule log data. Each match between data plane and Application rule creates a log entry with the data plane packet and the matched rule’s attributes.
So, let’s start with getting logs enabled on your Azure Firewall. You can’t query your logs if there are none! And Azure Firewall does not enable this by default. I’d generally recommend enabling logs as part of your build process and I have an example of that using Bicep over on Github, (note this is Diagnostics mode, I will update it for Resource mode soon!) However, if already built, let’s look at simply doing this via the Portal.
So on our Azure Firewall blade, head to the Monitoring section and choose “Diagnostic settings”
Azure Firewall blade
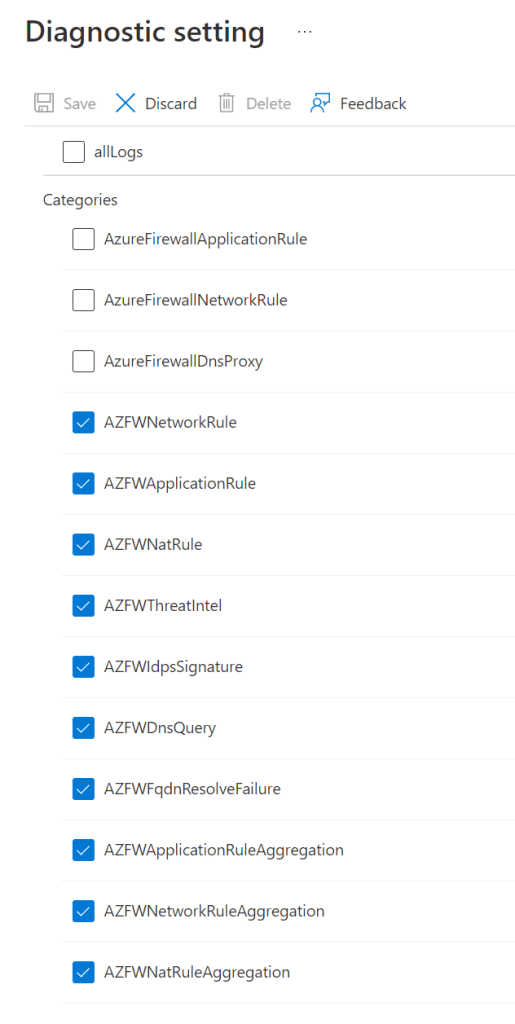
We’re then going to choose all our new resource specific log options
New resource specific log categories in Portal
Next, we choose to send to a workspace, and make sure to switch to Resource specific.
Workspace option with Resource option chosen in Portal
Finally, give your settings a name, I generally use my resource convention here, and click Save.
It takes a couple of minutes for logs to stream through, so while that happens, let’s look at what is available for analysis on Azure Firewall out-of-the-box – Metrics.
While there are not many entries available, what is there can be quite useful to see what sort of strain your Firewall is under.
Metrics dropdown for Azure Firewall
Hit counts are straight forward, they can give you an insight into how busy the service is. Data Processed and Throughput are also somewhat interesting from an analytics perspective. However, it is Health State and SNAT that are most useful in my opinion. These are metrics you should enable alerts against.
For example, an alert rule for SNAT utilisation reaching an average of NN% can be very useful to ensure scale is working and within limits for your service and configuration of IPs.
Ok, back to our newly enabled Resource logs. When you open the logs tab on your Firewall, if you haven’t disabled it, you should see a queries screen pop-up as below:
Sample log queries
You can see there are now two sections, one specifically for Resource Specific tables. If I simply run the following query:
AZFWNetworkRule
I get a structured and clear output:
NerworkRule query output
To get a comparative output using Diagnostics Table, I need to run a query similar to the below:
// Network rule log data
// Parses the network rule log data.
AzureDiagnostics
| where Category == "AzureFirewallNetworkRule"
| where OperationName == "AzureFirewallNatRuleLog" or OperationName == "AzureFirewallNetworkRuleLog"
//case 1: for records that look like this:
//PROTO request from IP:PORT to IP:PORT.
| parse msg_s with Protocol " request from " SourceIP ":" SourcePortInt:int " to " TargetIP ":" TargetPortInt:int *
//case 1a: for regular network rules
| parse kind=regex flags=U msg_s with * ". Action\\: " Action1a "\\."
//case 1b: for NAT rules
//TCP request from IP:PORT to IP:PORT was DNAT'ed to IP:PORT
| parse msg_s with * " was " Action1b:string " to " TranslatedDestination:string ":" TranslatedPort:int *
//Parse rule data if present
| parse msg_s with * ". Policy: " Policy ". Rule Collection Group: " RuleCollectionGroup "." *
| parse msg_s with * " Rule Collection: "  RuleCollection ". Rule: " Rule
//case 2: for ICMP records
//ICMP request from 10.0.2.4 to 10.0.3.4. Action: Allow
| parse msg_s with Protocol2 " request from " SourceIP2 " to " TargetIP2 ". Action: " Action2
| extend
SourcePort = tostring(SourcePortInt),
TargetPort = tostring(TargetPortInt)
| extend
    Action = case(Action1a == "", case(Action1b == "",Action2,Action1b), split(Action1a,".")[0]),
    Protocol = case(Protocol == "", Protocol2, Protocol),
    SourceIP = case(SourceIP == "", SourceIP2, SourceIP),
    TargetIP = case(TargetIP == "", TargetIP2, TargetIP),
    //ICMP records don't have port information
    SourcePort = case(SourcePort == "", "N/A", SourcePort),
    TargetPort = case(TargetPort == "", "N/A", TargetPort),
    //Regular network rules don't have a DNAT destination
    TranslatedDestination = case(TranslatedDestination == "", "N/A", TranslatedDestination),
    TranslatedPort = case(isnull(TranslatedPort), "N/A", tostring(TranslatedPort)),
    //Rule information
    Policy = case(Policy == "", "N/A", Policy),
    RuleCollectionGroup = case(RuleCollectionGroup == "", "N/A", RuleCollectionGroup ),
    RuleCollection = case(RuleCollection == "", "N/A", RuleCollection ),
    Rule = case(Rule == "", "N/A", Rule)
| project TimeGenerated, msg_s, Protocol, SourceIP,SourcePort,TargetIP,TargetPort,Action, TranslatedDestination, TranslatedPort, Policy, RuleCollectionGroup, RuleCollection, Rule
Obviously, there is a large visual difference in complexity! But there are also all of the benefits as described earlier for Resource Specific. I really like the simplicity of the queries. I also like the more structured approach. For example, take a look at the set columns that are supplied on the Application Rule table. You can now predict, understand, and manipulate queries with more detail than ever before. You can check out all the new tables by searching “AZFW” on this page.
Finally, a nice sample query to get you started. One that I use quite often when checking on new services added, or if there are reports of access issues. The below gives you a quick glance into web traffic being blocked and can allow you to spot immediate issues.
AZFWApplicationRule
| where Action == "Deny"
| distinct Fqdn
| sort by Fqdn asc
As usual, if there are any questions, get in touch!
There is a new format of logs coming to Azure resources. Currently most people are familiar with what is called Diagnostics Table logs. The resource log for each Azure service has a unique set of columns. The AzureDiagnostics table includes the most common columns used by Azure services. If a resource log includes a column that doesn’t already exist in the AzureDiagnostics table, that column is added the first time that data is collected. If the maximum number of 500 columns is reached, data for any additional columns is added to a dynamic column.
Resource Specific logs however are platform logs that provide insight into operations that were performed within an Azure resource. The content of resource logs varies by the Azure service and resource type. Resource logs aren’t collected by default.
So onto enabling them. Via the Portal, this is straight forward in terms of choice and is well documented here. However, when I went to include this enablement in a Bicep build that I have, I noticed there wasn’t anything clearly documented. So, here is an example using Azure Firewall.
Normally, my diagnostics resource looks like the below and this enables Diagnostics table logs:
However, to enable Resource Specific, a few changes are required. Obviously the category names are different however you also need to include the Property – logAnalyticsDestinationType as you see below on line 5.