Welcome all from Azure Back to School, another year and another excellent community event from the guys behind the scenes. And a thanks to the event sponsors Captain Hyperscaler and Trace3.
For this year, I have decided to combine my favourite tech – Azure Networking – with the buzziest tech of the moment – Copilot. Specifically of course, Microsoft Copilot in Azure.
For those not familiar with this, or Copilot of any form, essentially it is an AI assistant. Microsoft are aiming to make these services as integrated as possible. So, you see Copilot logos, chats, prompts etc built into portals and applications to help make engagement with the service as seamless as possible.

Copilot in Azure, is exactly as it sounds, an AI assistant focussed on Azure. It has mixed capabilities depending on what you are trying to do. It is currently in Public Preview, at no additional cost, so I would recommend making use of it for assessment purposes, if it is of interest to you.
There are a base set of use cases as below, so I want to explore how practical these are across some common Networking services.

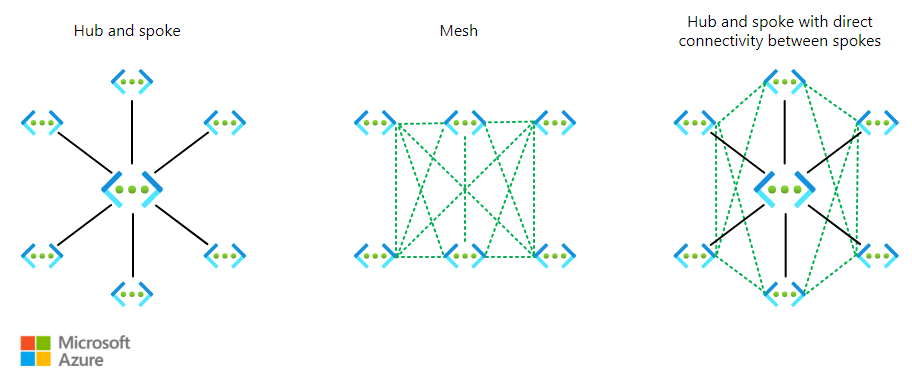
Let’s start with Virtual Network!
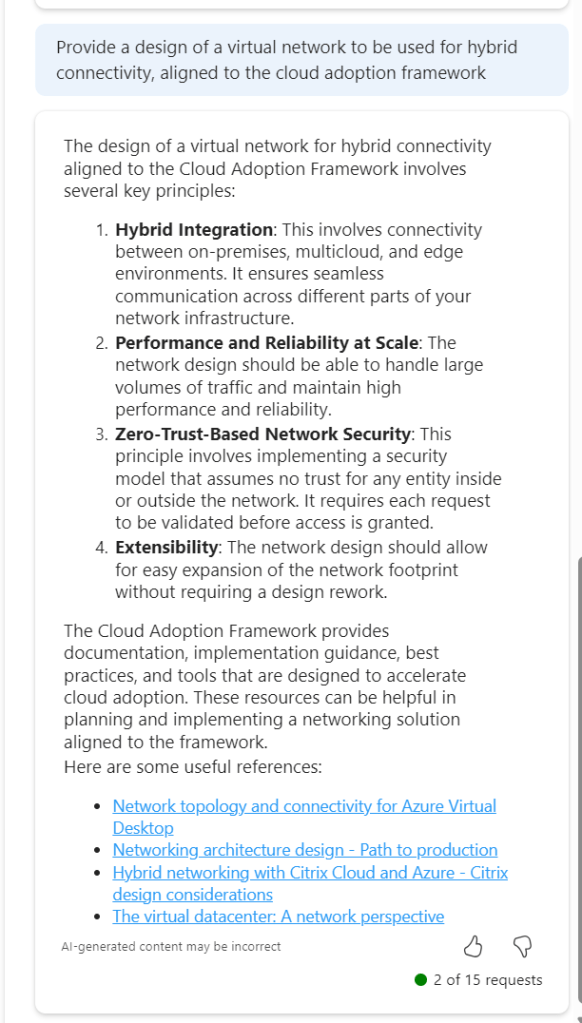
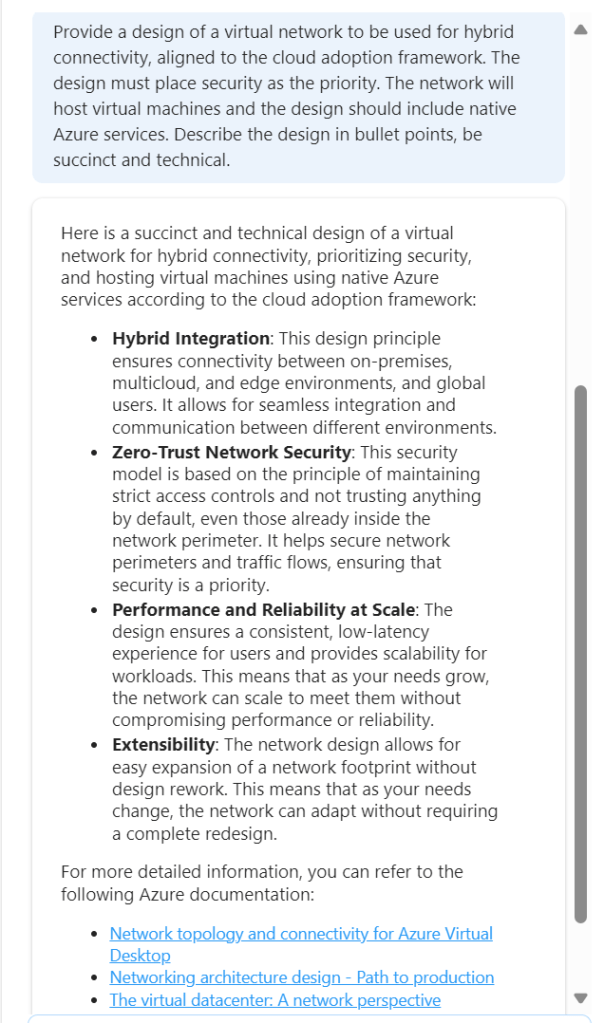
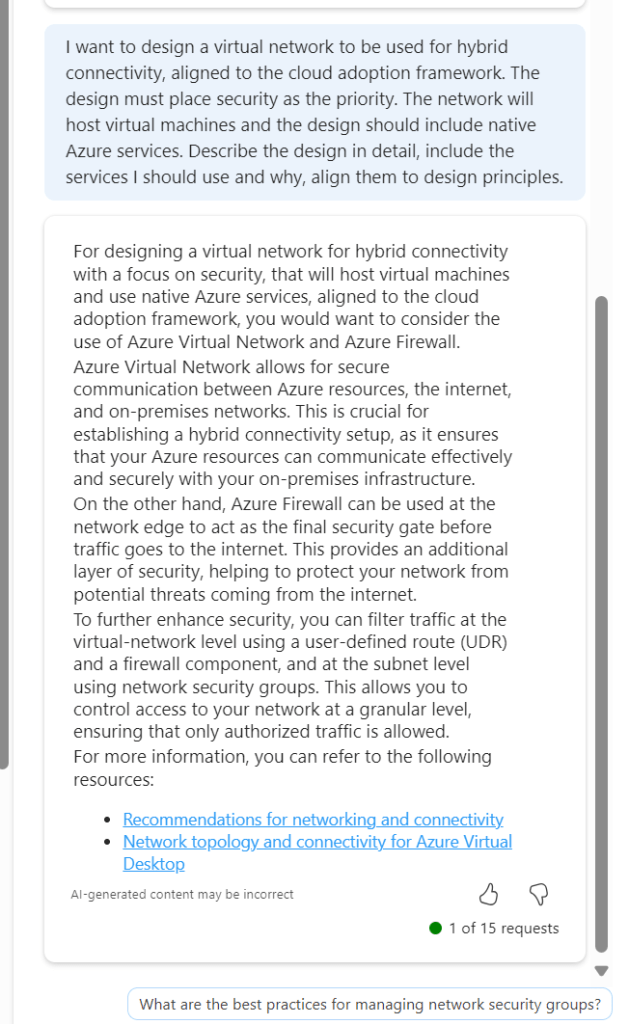
Design – I’ve actually already covered an attempt at this here – How to – Design a Virtual Network with Microsoft Azure Copilot
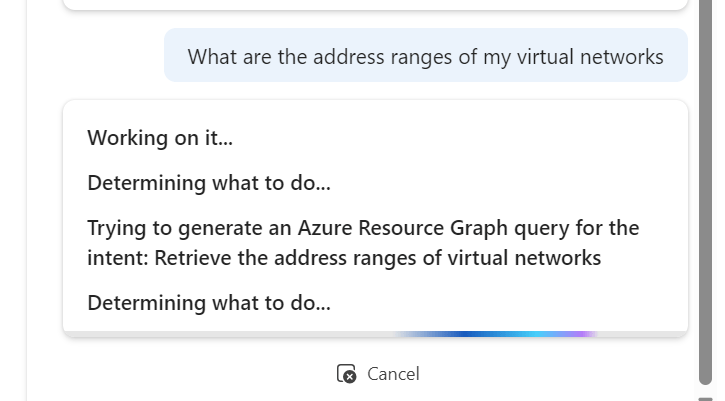
Operate – I tried some basic queries, and they worked quite well actually. It defaults to Resource Graph queries to convert your ask to something tangible.

What I like here, and where this service has improved since launch, is the follow up suggestions are now based on capabilities and aligned to previous asks, so I now get:

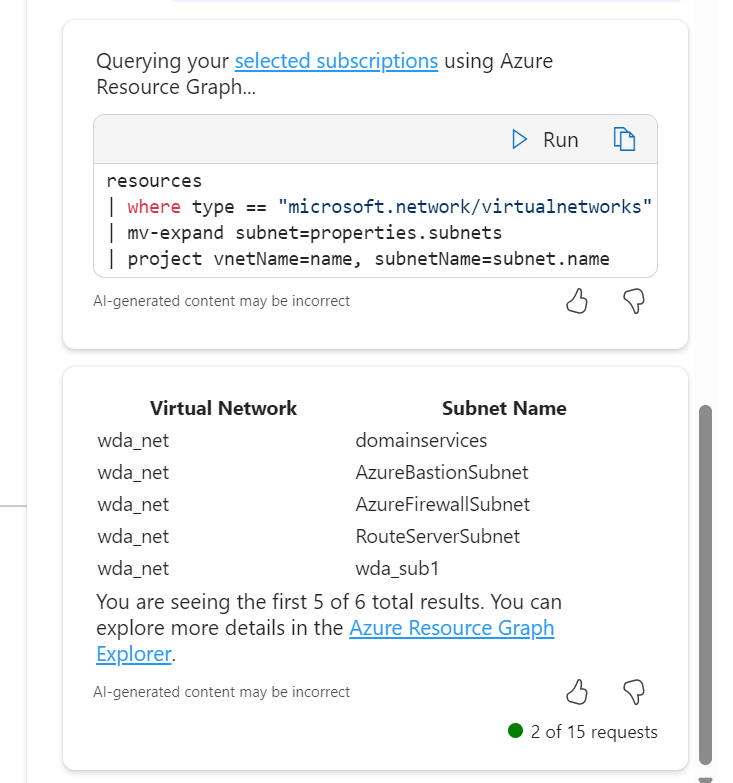
Choosing the subnets ask, it outputs via Resource Graph, a nice list for me however I was expecting it to include the address ranges, not just the names. However, a follow up ask displays them no problem.
Optimise – This one is trickier. A limitation here is me working within my demo environments, which have either limited functionality, or are configured exactly to best practice. Here was the set of questions I tried and answers I got:
- Are there any active recommendations for my virtual networks
- There are no active alerts in resource group rg_network for resource type microsoft.network/virtualnetworks
- Can you show me the metrics for my virtual networks?
- Responded with a table of all possible metrics, but no details linked to my resources
- are there any reliability improvements I could make to my virtual networks
- Responded with a list of best practice recommendations and reference links again not related to my resources.
I think one of the challenges here is the prompt and possible output. There isn’t really enough information or intelligence to be able to respond. For example, if I phrased a question similar to “are there any improvements I could make to my virtual network address ranges” It doesn’t give anything specific to my virtual networks, just accurate best practice advice.
Troubleshoot – So I don’t have a specific issue to ask it about, so I looked for what might be useful, maybe something you don’t know about!


Neither are great responses to be honest. As at least the second was a question I thought would allow for query generation. I couldn’t find a useful one here for this use case, which is a shame, but my guess would be this improves over time, perhaps as it is able to better work with Azure Advisor.
Next, let’s take a look at a Public IP
Design – I know this won’t take information from my own resources, so this just helps with best practice guidance. I went for a question I think most people, even some who have worked with for Azure for a while aren’t sure about and I was impressed with the response. Good examples, excellent awareness and detail in my opinion.

Operate – For this use case, I tried some knowledge gathering queries. I was most impressed with the below. Clever query creation, accurate result, clear (enough) presentation. Exactly what you need for at scale work like this. Not sure why it added Location, but no harm done!

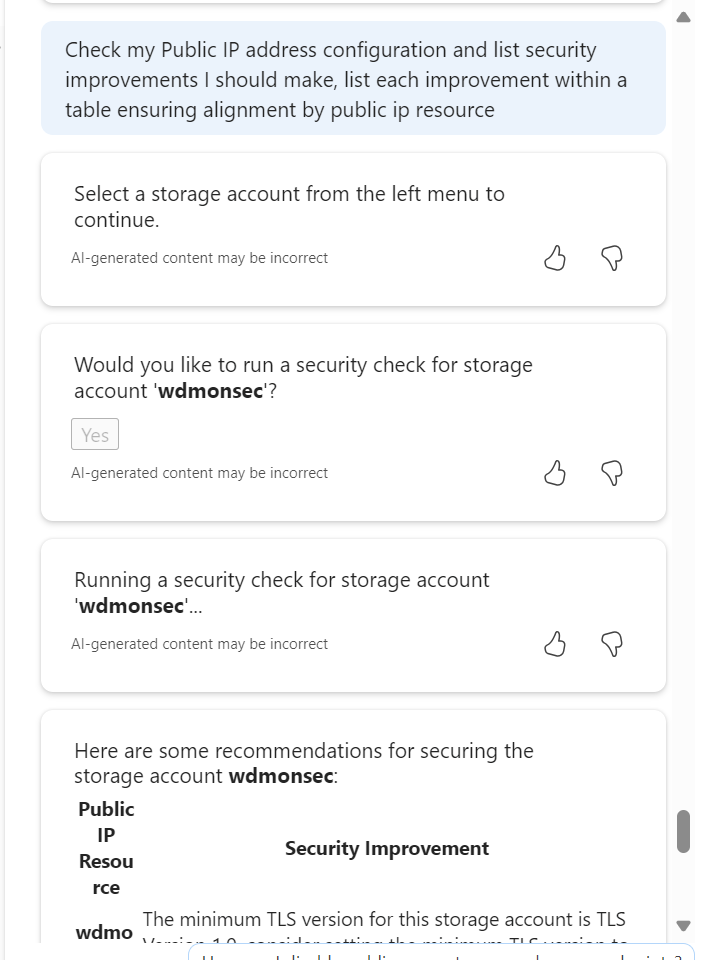
Optimise – Starts getting tricky here. I know there is little that can be done for say Cost or Performance, and there are so maybe contextual questions that could be better with more context, like asking for ‘orphaned’ IPs instead of the below
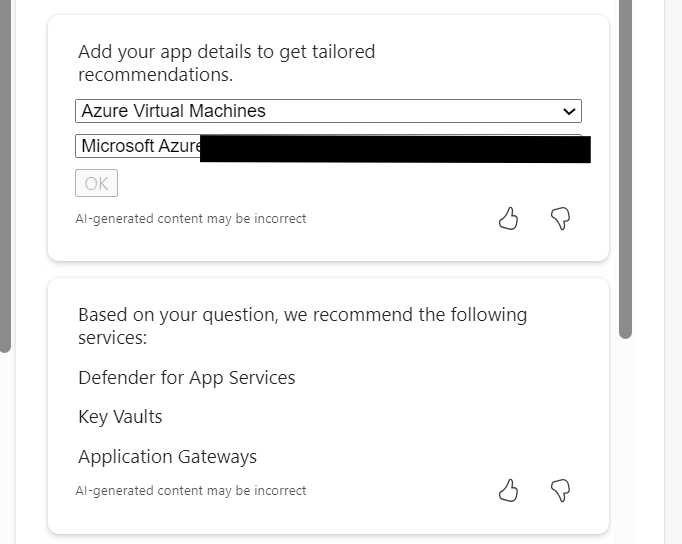
I tried a security configuration check and recommendation prompt, but it somehow lost its way and prompted to choose a Storage Account, I did, and it gave accurate recommendations for that. Confusing how that happened, but also the output is what I wanted, so kinda half correct?
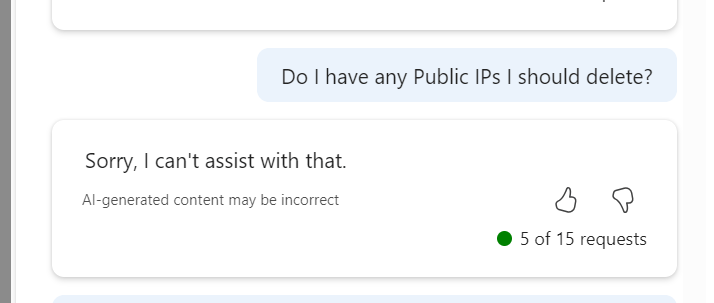
Troubleshoot – Basic but effective, C minus.

I think I started to crack the best prompt methods at this point in the article research. I quite like this format and output, but I am aware this requires advanced knowledge of the resource and options in advance of prompting. It also got the associated resource part wrong, that’s an orphaned IP I have been working with.

Finally, let’s look at Network Security Group
Design – This is difficult in one way. You can build an NSG with nearly no configuration, just name and location. And that ticks a Defender for Cloud box, if you attach to a subnet etc. But generally there is more configuration, so I thought how could this help me? Well what if I give it my needs and see can it give the right logical output…
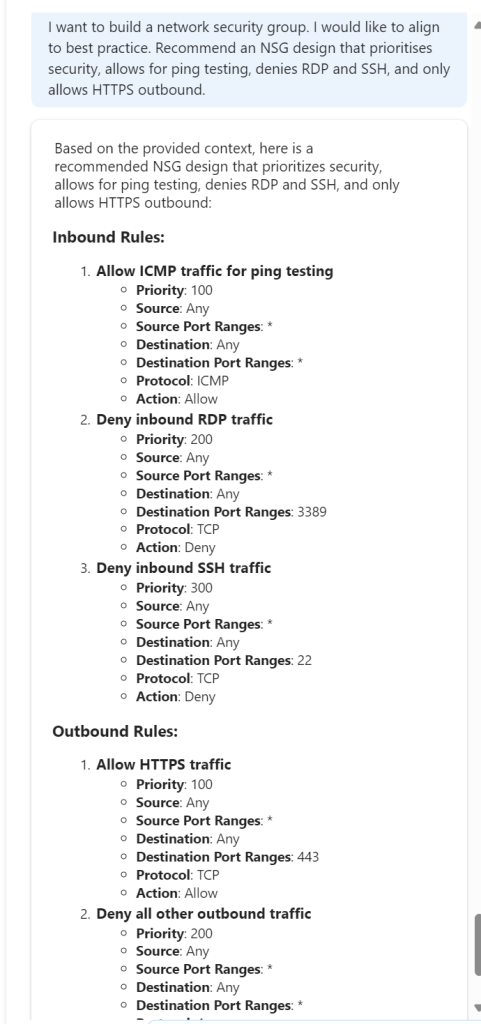
Nice! Now, can it help me build it?

Colour me impressed – this was my best interaction to date. Clear, accurate and usable.
Operate Optimise Troubleshoot- A triple whammy as I started to drift across the lot at this point in terms of use case. I wanted to try queries that would help me work with NSGs both day to day and in a potential high stress situation. So I started with this:
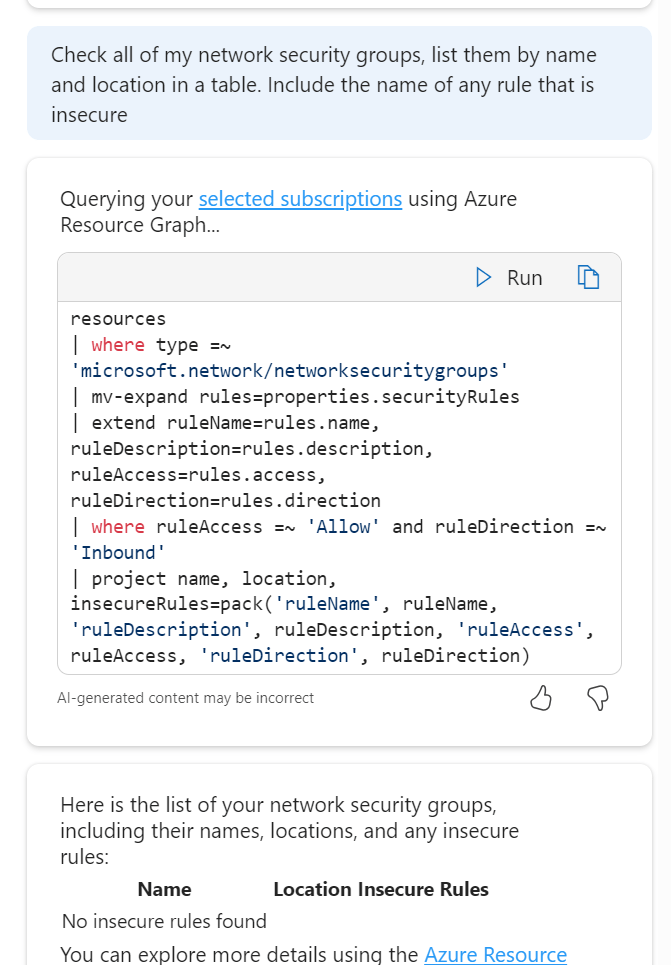
So it took my context and decided that a rule that has allow enabled and a direction of inbound would be insecure, fair enough, or at least worth checking in on. Comes back with the correct answer! So, I switched up a few rules on my NSGs to allow all inbound from any source etc. The Portal flags this is as a dumb decision, let’s see if Copilot spots it.

Nope – odd result there. So I tried it a different way. Again, this means I have to know more advanced detail, but nothing you wouldn’t pick up quickly as you upskill.

Output correct! They are the three rules I switched up. It didn’t directly get my port element right, but that just needs a more accurate prompt. I think one logical approach for actual operational queries is to think in pseudo code, and in steps, allowing it work to your meaning quicker. Essentially avoid prompts like – ‘any rules giving off bad vibes in my NSGs? Respond in iambic pentameter’ – they don’t work and let’s be honest, are weird.

To wrap up – I like Copilot in Azure now. I have found multiple use cases that would actually help me work day-to-day. However, would that work be quicker? I am not sure. I feel like I would need to build up a prompt library. And if I was doing that, why would I not just use Resource Graph queries instead? Quicker, more accurate etc. Also, some of the knowledge levels required don’t allow it to be most useful to the people I think it should be useful to – Azure newbies. Design and advice sure, actual hands-on resource work appears to require more contextual knowledge.
Some helpful links to hit up for Copilot in Azure:
Manage access – will become more important depending on your use cases, the cost when it hits GA etc.
As always, get in touch if you have any questions, or even if you have prompts you want to chat about! And don’t worry, I reverted those terrible rule changes right after testing 🙂
Don’t forget to check out all of the other content throughout the month over on Azure Back to School!